Machinery dealers are taking data analytics more and more seriously. Enterprise software vendors are offering amazing color graphics, pie charts, graphs, bar charts. But behind all this is the question, “What do you really need to know?” What information will provide you the most helpful and useful insights into pursuing your very best opportunities? Do you want to improve profitability? Increase aftermarket sales penetration? Expand your business into new areas?
Listed below are 11 of the most useful and insightful assessment tools machinery dealers are utilizing today to improve profitable operations across the board. These 11 tools include applications in Corporate Strategy, Machinery Sales and Rentals and Aftermarket Parts and Service.
A few cutting-edge dealers have appointed a Marketing Insights Manager to help identify and exploit this information. They are tasked with assisting owners/ executives, machinery sales and aftermarket management teams identify and pursue their most attractive opportunities.
Most of these analytical can be developed from readily available dealer information. The place to start is at the beginning: What are our priority strategic objectives? What information do we need to best clarify that picture? Then, how do we access and capture needed data?
Each application is explained below. References are provided for further “how to” details in one or more of my dealer management textbooks.
Corporate Strategy
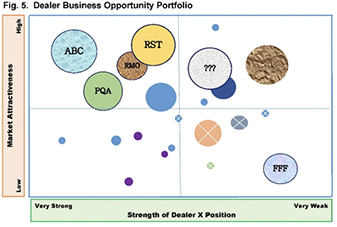
1. Dealer Business Opportunity Portfolio
ANSWERS THE QUESTION: Which products/services should we sell in what markets?
Most dealers have far more product/ service opportunities than can be effectively and competitively managed or properly supported.
In many respects a machinery dealership can be thought of as a mini-conglomerate comprised of many smaller businesses with vastly differing opportunities and probabilities of success. And, “conglomerates” have a tool we can use at the dealer level called “Portfolio Analysis.”
A widely used strategy development tool is the Investment Portfolio Analysis. This analytical device was developed in the 1970’s by the Boston Consulting Group as a Growth-Share Matrix. It is based on classifying business units (opportunities) into four categories based on market growth (attractiveness) and market share (dealer strength) relative to the largest competitor.
The matrix is developed by creating a list of 10 “Market Attractiveness Criteria” This could include strategic fit, market size, market growth, level of competition, dealer experience in this area. Each opportunity is scored 1-5 and provides a position on the X axis in the illustration above.
Next, 10 “Strength of Dealer Position Criteria are listed including current market share, expertise in this area, current relationships, overall competitiveness. Each opportunity is again scored 1- 5 to determine the Y axis position.
You can see in the illustration above that opportunities in the top left quadrant represent very attractive opportunities in which the dealer has strong position. And, these should be considered a priority focus for possible development.
In my Strategies, Tactics, Operations for Achieving Excellence (STO), Chapter 2, we examine how this type of Matrix structures and illustrates a dealer’s Corporate Business Opportunity Portfolio. It can serve as an important starting point for discussing resource allocations among strategic business units and alternate business investment opportunities. It can also help management determine which opportunities should be aborted or exited.
Additional Information: STO pages 35 – 60
2. Competitive Analyses
ANSWERS THE QUESTION: What comparative information must we have about our big competitors.
Almost all customers say their dealers do not have enough competitive information. This lack of competitive information inhibits the dealer from developing and providing support services to meet customer expectations. To fend off the competitive assault you must understand the competition’s position and not just guess what it is. The biggest danger is a “me too” strategy. When forced into “me too” you are forced into price selling. Your differentiation is essential to defuse competition’s strengths. Competitive information enables you to build better, stronger strategies.
You are not focusing on what the competitor does, but rather the buyer’s reaction and perception of your performance versus your competitor’s. This valuable information can be obtained from a senior contacts in four or five of your largest accounts. They have exposure to both your dealership’s performance as well as your compeitors. And you can easily ask the if you are stronger or weaker in several areas such as reliability, responsiveness, sales force knowledge, product support, fix it right the first time or, knowledge of customer’s business. If you use an outside, 3rd party to conduct these interviews, you can see that the customer would tend to be a lot more open and critical.
Important areas to include in your survey are:
| Area One: | Product | Most Selling is Done Here |
| Area Two: | Service/Product Support | Most Customer Decisions Are Made Here But, Sales Reps usually do not perform well in Area Two! |
| Area Three: | Image | Reputation for meeting customer needs. |
| Area Four: | Relationships | Ability to reach key players, manage win-win. |
Competitive analysis should be done from the perspective of the customer. You have to stand in his shoes. Be empathetic. See his point of view. Then, work on improving your weak areas.
Goal:
Which strengths or weaknesses of competitors do we need to go after?
Where are we strong or weak where we can improve?What actions can we take?
How do we take advantage of competitors’ weaknesses?
How do we negate their strengths?
Your Competitive Response can be based on the assessments completed on a comprehensive competitive analysis. I suggest 3 large account interviews in each of your primary customer market segments.
In STO and further discussed in my Achieving Excellence in Dealer Distributor Performance (AE) there are some worksheets you can use. We highly recommend a 3rd party competitiveness perception study be completed with customers at least every three years.
Additional Information: Guidelines for developing highly useful competitive analyses in contained in STO pages 435 – 440 and AE pages 238 – 239.
3. Key Account Strategic Profile
ANSWERS THE QUESTION: What information must we maintain about our largest accounts?
Success in the very competitive equipment business means concentrating limited resources on those opportunities with best chances of high return. The successful dealer must safeguard those investments by systematically managing committed resources.
Look for Key Account information that tells you, given current trends, where your customer is going. What are their strategic concerns? How can your value proposition best partner you with the account? Assemble and condense this information in the Key Account Strategic Profile. Make this information available to all members of your Account Development Team. (Ask me to send you a free set of Key Account Profile Worksheets.)
Key Accounts are EXTERNAL ASSETS. Because Key Accounts are critical to the survival of your business, we don’t simply consider them customers or accounts. We must see them as EXTERNAL ASSETS. (But, NOT on the balance sheet!)
If they are company assets, they must be managed as assets. The days are long gone when an equipment dealer could keep a Key Accounts on the basis of traditional business ties or Customer Loyalty. Businesses that think they can keep Key Accounts alive without aggressive, studious management are forfeiting customers to competitors every day.
A Dangerous Attitude: “We Don’t Have to Work for the Business.”
When a company thinks a Key Account doesn’t need management, it implies the business is a “sure thing.” The attitude implicit in such a claim is the most dangerous one any dealership can have. From the customer’s point of view, such confidence always translates into “cockiness.” As soon as your customer believes you don’t have to work for his business, he will start looking for other suppliers. As soon as your customer thinks you are taking his business for granted, bad things begin to happen.
Three important facts:
- The systematic management of Key Accounts is becoming more and more critical to business survival and prosperity, especially in the construction equipment industry.
- Few dealers know how to manage Key Accounts effectively, as the major business assets that they are.
- The Key Accounts know how they should be managed. You just have to ask them.
Additional Information: A comprehensive give to successful Key Account Management is found in STO pages 438 – 445.
4. Daily Flash Report
ANSWERS THE QUESTION: What financial and operations data must we monitor daily?
The Dealer Management Dashboard or Flash Report is a type of graphical user interface with provides at-a-glance views of key gross profit and gross margin percentage performance indicators in new and used machinery sales, rentals, service and parts. The model Flash Report also highlights, Days Work in Process, YTD Absorption Rate, Service Department Recovery Rate, Cash Management (including Line of Credit, Current Balance and Float. Data points that are below budget are highlighted in red.
The Daily Flash Report helps executives spend less time collecting and sifting through data and more time visualizing a unified, enterprise-level data analysis and decision support platform. This enables management to make course corrections quickly rather than waiting weeks for historical monthly financial statements. This empowers management to make corrective actions that have immediate impact during the operating period to enhance performance in real time.
Additional Information: As me to send you the Dealer Flash Report used by the most successful dealership in his OEM dealer network.
Machinery Sales and Rentals
5. Market Segmentation and Highest Priority Targets
ANSWERS THE QUESTION: What are the highest priority end user market segments in each territory?
It is often only by the rarest coincidence that your field sales reps, left to their own devices, will promote and sell products into your most strategically important markets. We know that all prospects are not created equal. The secret is to focus your marketing and selling efforts on the “target market segments of greatest opportunity.” Unless you assist your sales team in identifying and evaluating the best customer types for your dealership, your sales reps cold be making a lot of calls on the wrong accounts.
Remember, much of the time, sales reps only sell products they know into markets they understand. And, your efforts to define and clarify their sales development efforts will help ensure they are focused on the end user applications and product programs essential to your strategic success. This is a similar analysis to number 1. above but the focus is at the territory level includes current product programs and all potential end user segments.
Additional Information: AE pages 232 – 237, “How to Perform Dealer Market Segmentation.”
6. Territory Sales Velocity and Effectiveness
ANSWERS THE QUESTION: What minimum level of territory sales activity must be achieved?
SALES VELOCITY is defined as “Customer Touches per Month.” A “Touch” is any type of customer contact. A good goal is over 200 per month. How many “touches” does it take to sell one of your units? This is called SALES EFFECTIVENESS.
Once you determine this Sales Effectiveness ratio for your top performers, you can set realistic customer contact targets for the rest of your sales organization.
One important issue is sales people often have too many accounts. CALL FREQUENCY for each type of account must be developed based on fleet size and number of contacts. This drives the number of accounts that can be effectively covered. Determining Call Frequency is one of the very first steps in effective sales territory management.
Many dealers find establishing proper call frequency to be a great sales tool and have tweaked their CRM system to make this easy to track. The CRM system motivates the sales reps to work more effectively.
An expanded discussion of this topic is in my 25 Profit Building Tools for Machinery Dealers (25PBT), Chapter 21, “Increase Sales Rep Productivity.”
Additional Information: How to structure and monitor Sales Velocity is shown in 25PBT pages 155 – 160
7. Rental Time and Dollar Utilization by Unit with Maintenance %
ANSWERS THE QUESTION: What must we monitor for success in our rental machinery business?
The secret to a successful equipment rental business is to keep maintenance cost low, time and dollar utilization high and feed “saleable” units to the used equipment sales team. Just monitoring time utilization can be very misleading because it does not reflect discounting or poor pricing practices. Dollar utilization is the traditional tool used to “balance” short term rental against Time (or Unit) Utilization. A dealer can have 95%-time utilization and a very distorted profit situation, especially if substantial internal discounts are given to the rental department by parts and service. Time utilization is days rented by unit divided by 365. Dollar utilization is Total Rental Revenue by unit divided by rental rate x 365.
Additional Information: AE pages 104 – 110
8. Used Equipment Over/Under Report
ANSWERS THE QUESTION: What must we monitor for success in our used machinery business?
Used machinery can be a huge cash trap. “90 days and out” is an excellent axiom and yields 4 annual turns. Significant management attention and controls are essential to maintain high turns and maximum margins in the used equipment operations. Used equipment can also be a burial ground for new equipment sales mistakes and excessive over-allowances. An “Over and Under Report” was created by an equipment dealer selling between 500 and 600 used units per year and an equal number of new. The value of the report was that it monitored book values vs. wholesale values (immediate cash sale value) on an Excel spreadsheet. Wholesale values can change very rapidly in declining or uncertain market conditions. And, if Book Value exceeds Wholesale Values, the unit is “upside down” in terms of value. The spreadsheet enabled the owner to quickly scan for units that were “upside down” and monitor the totals for his whole used equipment inventory.
Additional Information: AE pages 111 – 120 contains an excellent Over/Under Report example.
Aftermarket Parts and Service
9. Parts and Service Sales as Percent of Available Business
ANSWERS THE QUESTION: What is our current aftermarket market share?
There are some highly useful tools to assist dealers build aftermarket marketing strength. But they are seldom used. Most machinery manufacturers today have the ability to assist their dealers calculate parts market share. This is derived from an annual machinery parts consumption factor for each equipment category multiplied by the number of units shipped in your territory. To develop this parts consumption factor for each type of equipment, you can check your rental maintenance records for parts consumption by equipment category. Another source of this useful data is the maintenance records of customers who keep accurate records like public utilities. Used dealer selling price, or wholesale, for the consumption factor value.
Parts consumption data is an extremely helpful tool to assess market size, potential and your parts sales penetration success. You can determine parts sales penetration for each category of equipment by dividing parts sales for that equipment category by market potential (based on delivered units x parts consumption factor). A reasonable Parts Sales Goal should be established for each category of equipment you sell.
We have tracked consumption factors for several machine categories with approximate annual parts consumption factors at retail. If parts your sales are below 40% of market potential for any machine category, it may indicate one or more of the following situations: the dealership is under-promoting parts, customers are under-maintaining their units, the dealership is not adequately performing PM inspections, or, the dealership is losing aftermarket business to other competitors, will-fitters or jobbers. Even if you are just 23% today, the objective is to make annual stretch goals and work toward achieving them. If you are at 23% now, set a goal to reach 35% next year.
Additional Information: AE pages 77 – 79 and AE 89
10. Customer Aftermarket Sales Opportunity
ANSWERS THE QUESTION: What is our aftermarket sales potential in each account?
Ranking service sales and parts sales direct to customers is nothing new. This is easily done by identifying and ranking sales to your largest aftermarket accounts. The added, most useful new dimension is determining “aftermarket potential” by account. Account aftermarket potential is based on the number of dealer units he owns times an annual labor and parts “consumption factor” for each category of equipment he owns. Then, the whole customer list is ranked by aftermarket potential, large to small.
Your aftermarket sales opportunity is the account’s total potential, less your current service and parts sales to him. You should rank service customers separately from parts direct customers who do their own maintenance. Which of your current accounts offer you the greatest incremental sales opportunity based on their current mix of units? This is extremely valuable information and enables a highly focused business aftermarket development effort based on just a little work in Excel. (If you don’t know what your customers own, it’s time for a customer census.) I expect you will be very surprised to learn which accounts are your most promising new business targets.
Your estimate does not have to be exact. If you have many lines, first focus your efforts on your largest and most populous units. If you sell underground tools such as directional drills and trenchers, they consume large amounts of parts and supplies annually. So, do parts and supplies separately from labor sales.
If you sell everything from wheel loaders and excavators to skid steer loaders, you can develop one set of consumption factors for heavy equipment and another for light. This is a great part- time assignment for a young business administration student intern under supervision of your Marketing Insights Manager.
Which of your current accounts offer you the greatest incremental sales opportunity based on their current mix of units? This is extremely valuable information and enables a highly focused business aftermarket development effort based on just a little work in Excel.
Many dealers find it informative to create a large wall map of at least 24″ x 30″ representing customer locations and aftermarket potential denoted by the size of the account location symbol. This tool assists define geographic aftermarket sales opportunities. Managers find it easier to visualize geographic clusters of opportunity on a map vs. a columnar list of customers and prospects.
Very inexpensive software and printing resources are now available to create informative and helpful tools to assist and plan sales and customer support campaigns. Accounts can be indicated on the maps by a wide variety of symbols, sizes and colors to represent size of opportunity, type of account, etc. This greatly simplifies aftermarket territory sales management.
Additional Information: 25PBT pages 77- 88 and AE 146-158
11. Customer Incremental Aftermarket Gross Profit Potential
ANSWERS THE QUESTIONS:
What is our gross profit potential if we upgraded the entire large customer fleet to our primary lines?
What is our gross profit potential if we upgraded lower margin aftermarket accounts to the same gross profit margin as similar, but higher gross profit margin accounts?
How often do you, the Dealer Principal, or Senior Executive take time to really study your most important customers? What profit improvement opportunities are there in these valued customers based on attaining 95-100% of their business? What aftermarket service and parts potential for additional growth is there based on their current fleet size and composition? You may be getting a large portion of sales for 25% of their units. What if you were able to increase unit sales penetration to 80%. How can you use aftermarket sales development to drive new machinery sales?
The first step is to develop a “Customer Gross Profit Contribution Ranking Report” for Parts and Service Total Annual Revenue by customer.
This tool requires a little thinking and analytical investigation.
Examine all accounts with a large number of total units. Do a careful analysis of dealer revenue potential. What would be the revenue potential if you had, for example, all 200 units in an account instead of just the 25 you have now? What would be the value of adding parts and service sales for those additional 175 units you are not now servicing?
You must carefully study the potential and not just look in the rearview mirror at historical sales. This reminds us that manufacturers and dealers sell machines to sell Parts and Service. You must look at the customer’s business holistically to include Service, Parts and Sales. And, you surely must start with service and parts potential today. What parts and service revenue would you have with 50% of their fleet? How much more if you had 100% of their fleet?
By generating incremental market potential in each account, Product Support Sales Reps (PSSR’s) or Customer Support Reps (CSR’s) can now prioritize their business development efforts.
Have you ever asked why two very similar accounts with similar applications and fleet composition have very different gross profit margins? Every year you should examine why customers with similar size fleets and applications have such huge differences in Gross Profit Contribution for your business.
The annual Gross Profit Margin Ranking Report and Analysis of all service and parts accounts is fairly simple:
| Customer | City | Service and Parts Sales | Service and Parts Cost of Sales | Gross Profit | Gross Margin Percen |
Rank the report by Gross Profit Margin %, large to small.
What is the median gross margin percent? Look for very similar accounts below the median and examine why their margins are so low? Is it pricing? Discounts? Sales mix?
What can you do to increase the number of accounts in the top quartile? What do you need to do to move lower ranking customers of similar business size and description up to higher levels of sales penetration and profitability?
This examination is critical to understanding how the dealership is working and what can be done to improve profitability. Preparing for some recent workshops, we ran a similar gross profit margin ranking reports separately for Service, Parts, Machinery Sales and Customers Overall, with amazing and insightful results in each Revenue Center.
Additional Information: 25PBT pages 83 – 88
I trust you find application for one or more of these tools in your business. I look forward to discussing any of them with you. Please contact me at Walt@mcd.winsbystorage.com
For an expanded discussion on Best Practices in Machinery Sales Management as well as Sales Rep Performance Improvement Techniques, please see my:
- Achieving Excellence in Dealer/Distributor Performance, pages 217 – 288
- Strategies, Tactics, Operations for Achieving Dealer Excellence, pages 309 – 326 and pages 369 – 420
For a comprehensive look at Best Practices in Product Support Management, please see:
- Strategies, Tactics, Operations for Achieving Dealer Excellence, pages 101 – 160 and 221 – 270.
- 25 Profit Building Tools for Machinery Dealers, pages 47 – 64 and 161 – 166.
All three textbooks mentioned in this article are available on Amazon.com or on our website: The full four-volume Master’s Program in Dealer Management including the Dealer Problem Solving Handbook is now on sale on our website with 50% off Amazon price. In addition you will receive the comprehensive Self-Study Course only available from The McDonald Group, Inc.
Walter J. McDonald
winsbystorage.com/